
Environment
Environmental Policies and Practices
The Company sets an environmental policy with the intention to continuously maintain the environment according to the specified standards standards in order to make customers, communities and related parties realize that the Company attaches importance to environmental management and pollution prevention in all aspects of work. The Company will act as follows:
In 2020, the Company was awarded the Green Industry Level 2 Certificate for Green Activity in implementing activities to reduce environmental impacts as committed. Moreover, the Company also has a long-term plan to become certified as a Green Industry at a higher level.
Power Management
The Company recognizes the importance of energy consumption which is a key factor in business operations. The Company has prepared an energy management report. There is an ordinary energy reviewer registered to evaluate the Company’s electrical and thermal energy use.
These energy management data enable the Company to plan to reduce energy consumption and manage electricity efficiently. In 2020-2022, the Company’s energy consumption is as follows:
Total electrical energy consumption
Fuel energy consumption
Amount of production
In 2022, electricity consumption increased by 39,154 units while thermal energy consumption increased by 2,775,442.5 megajoules due to increased production capacity from 2021 to 504,903.32 kilograms, divided into dried fruit production, which increased by 245,059.41 kilograms, and canned fish production, which increased by 259,843.91 kilograms, increasing the cost of electricity by 4,049,700 baht.


- Switching to LED light bulbs
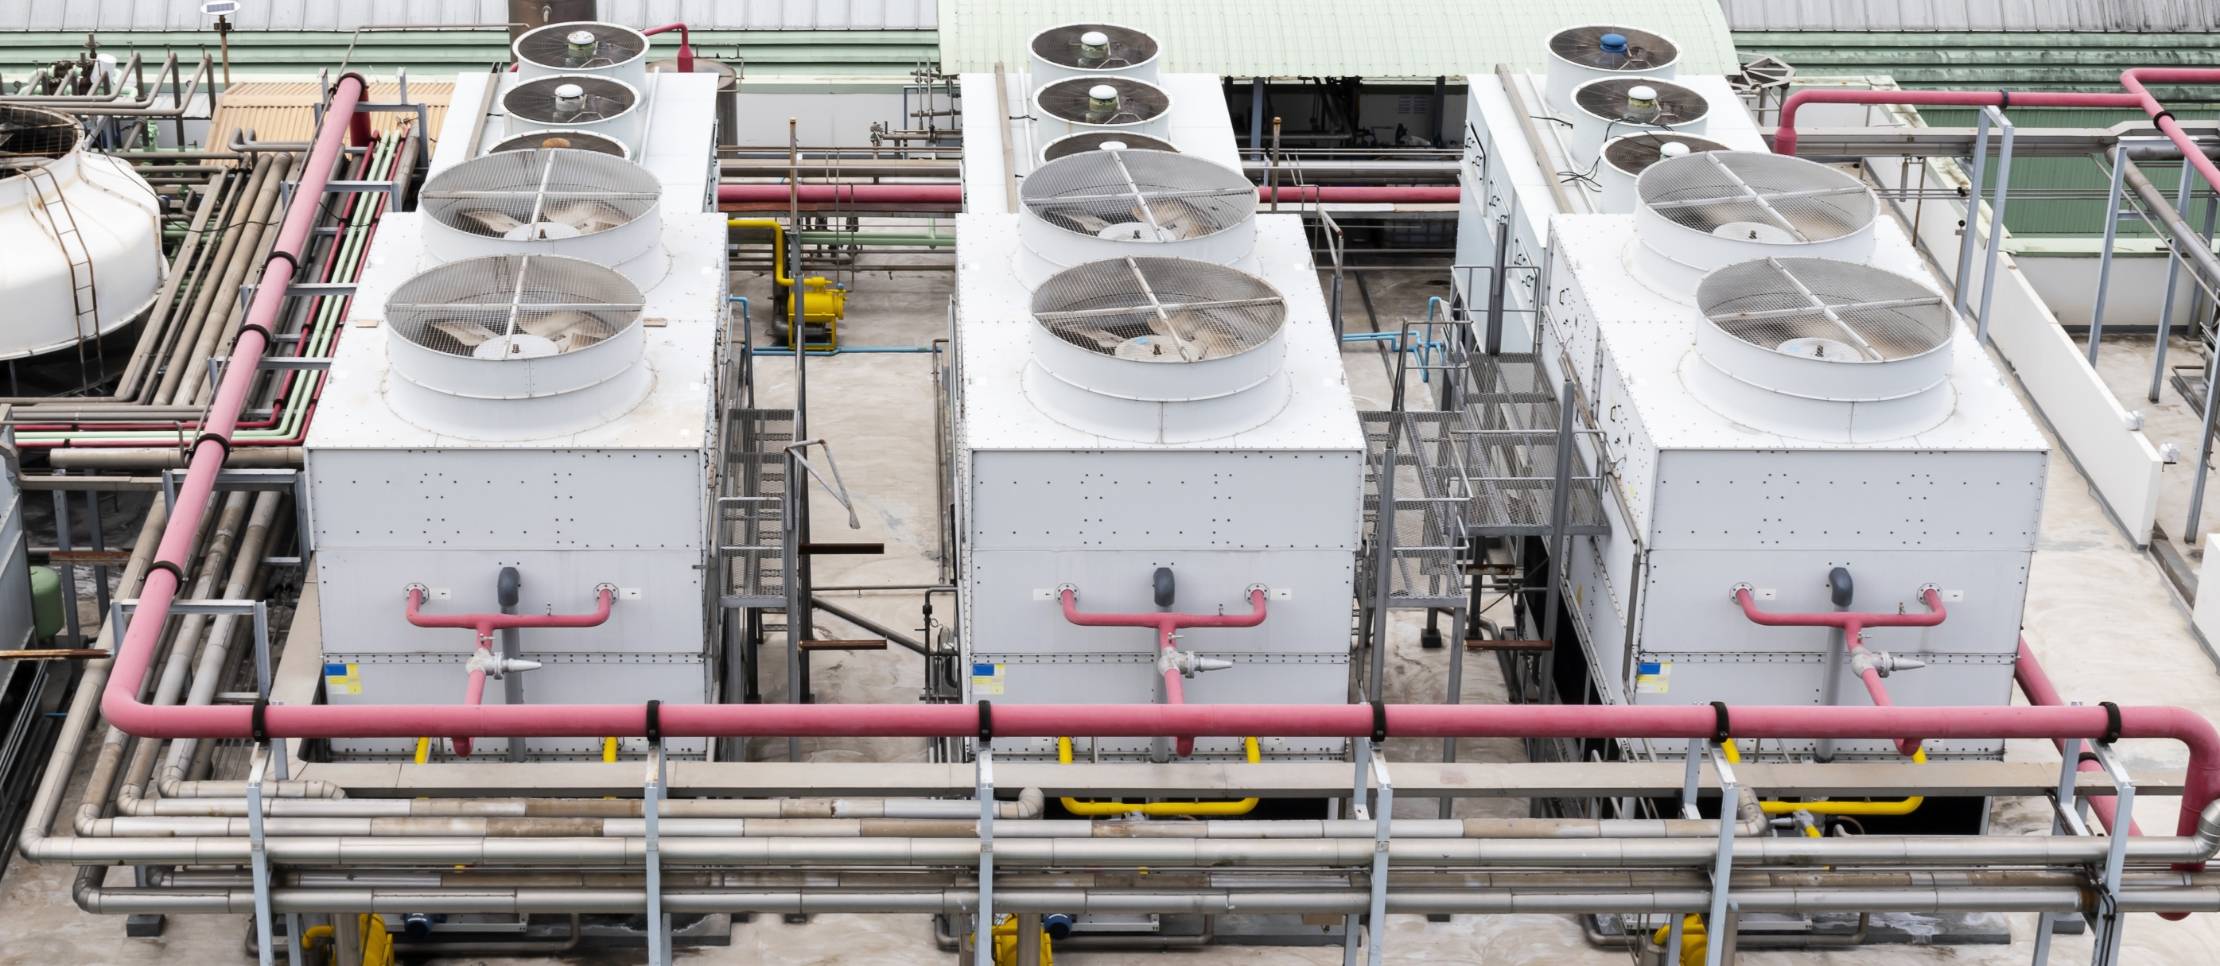
- Maintenance of chiller machines and water coolers
- Switching to high-efficiency air compressors
- Installing the glass light filter films and thermal curtains
- Reusing condensate water
- Improving Stream Trap
- Switching to LED light bulbs
- Maintenance of chiller machines and water coolers
- Reusing condensate water
- Installing the glass light filter films and thermal curtains
- Improving Stream Trap
- Switching to LED light bulbs
- Maintenance of air conditioning and freezer
- Reusing condensate water
- Improving Stream Trap
The Company has an energy-saving measure starting in 2019. The Company managed energy by switching to energy-saving LED light bulbs, periodically maintaining air conditioners and water coolers, and using the Stream Trap system and Valve Bypass Leak to reduce the loss and leakage of steam in the production process. From the aforementioned measures, electricity energy in 2019 was saved at 168,876 kWh, whereas heat energy was saved at 1,145,736 megajules. In 2020, the Company had energy-saving measures by switching to an additional 159 sets of LED energy-saving light bulbs, maintaining chillers and water coolers, switching to high-efficiency air compressors, installing light filter films, installing thermal curtains, reusing condensate water, and improving Stream Trap
The Company has implemented energy-saving measures since 2019. From 2022 to 2024, energy management initiatives included switching to energy-efficient LED light bulbs, ensuring proper maintenance of air conditioners and freezers, maximizing the utilizationof condensate water, and improving the Steam Trap system. As a result of these measures, the Company saved 206,430.60 kilowatt-hours of electricity and 2,821,689.87 megajoules of heat in 2022, 270,584.16 kilowatt-hours of electricity and 3,086,571.90 megajoules of heat in 2023, and 177,064.23 kilowatt-hours of electricity and 3,797,881.25 megajoules of heat in 2024
Water Management
All the water used in the factory’s production processes and office comes from tap water. The Company controls waste water from the production process that cannot be reused and wastewater from general use by giving importance to the law and people involved in nearby communities before releasing those waste waters to natural sources.
The Company has two biological wastewater treatment systems

Activated Sludge System

Anaerobic Filter system
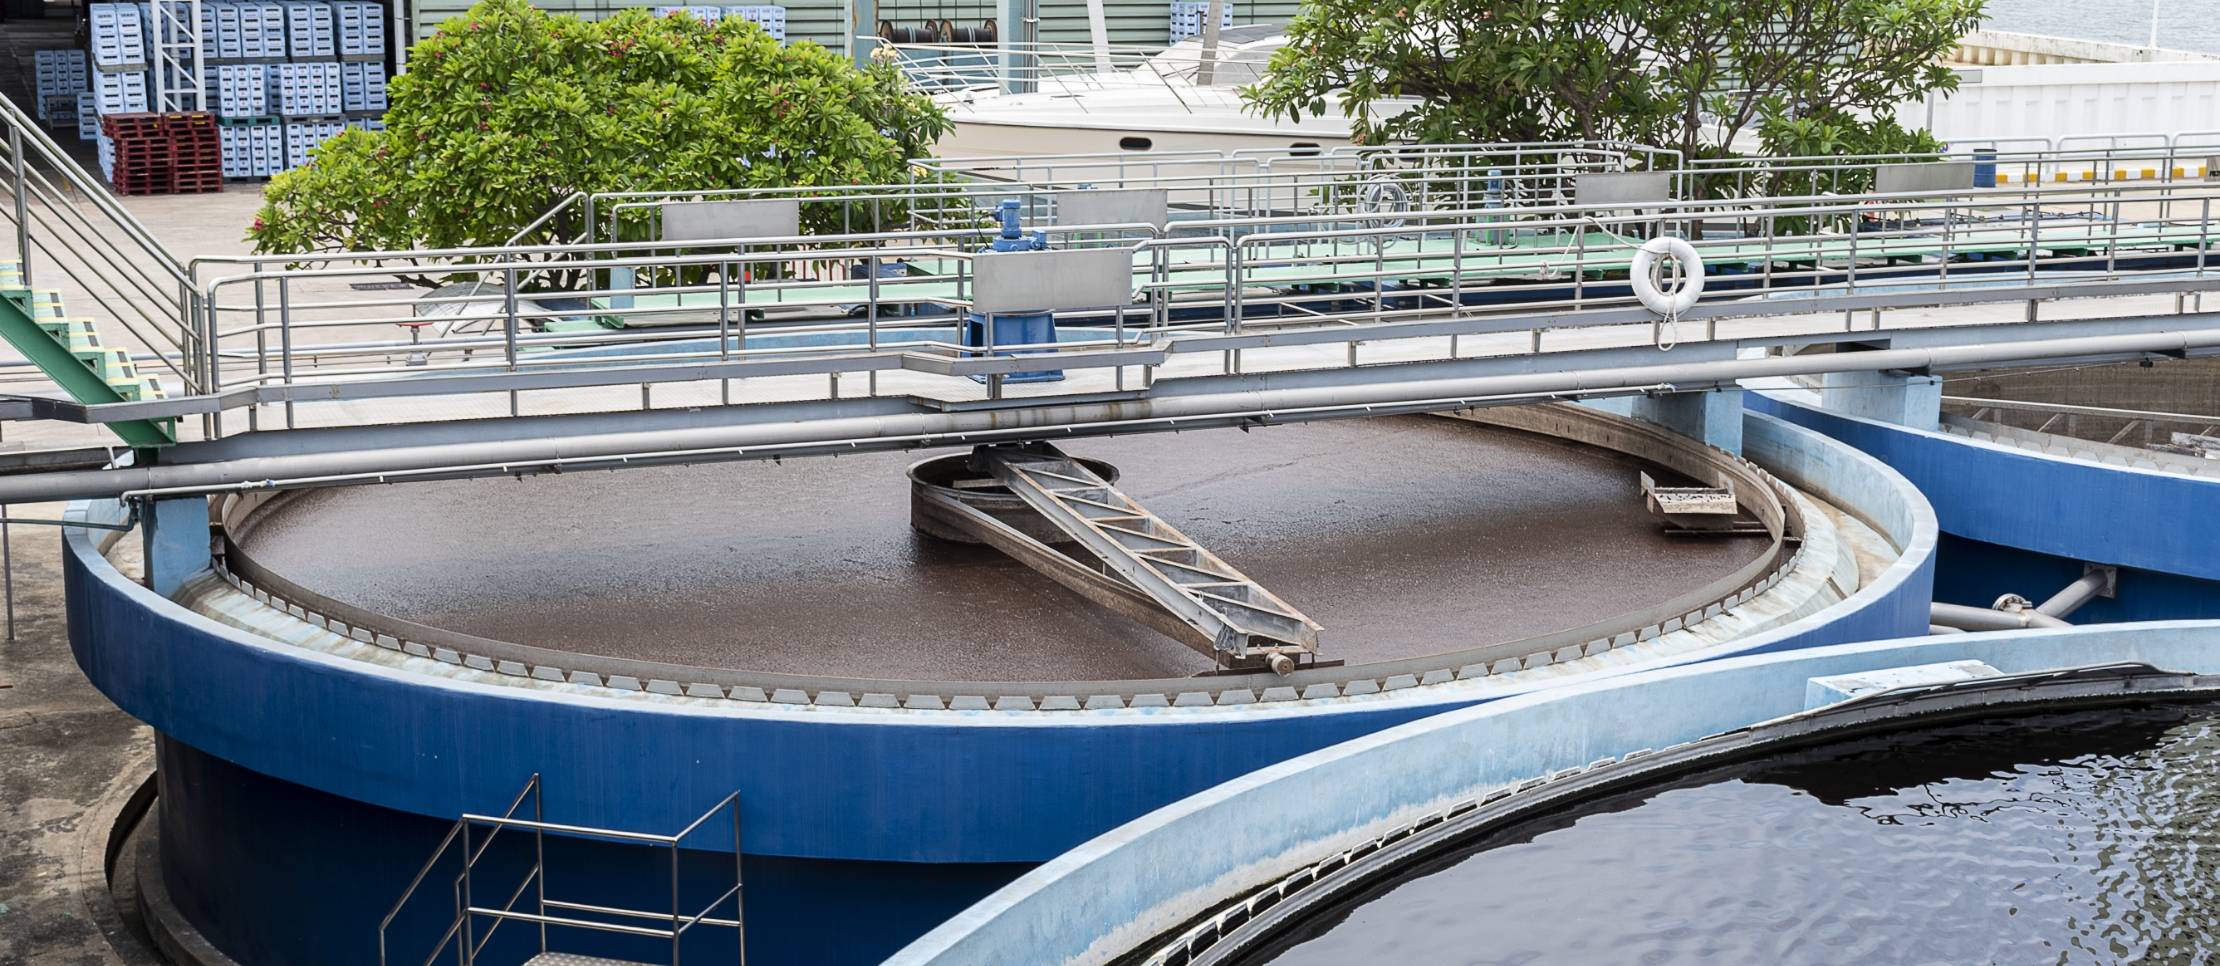
with quality measurements of the treatment system and the water quality in the treatment system on a monthly basis. The quality of treated wastewater will be measured before being discharged into the public sewer by a BOD Online machine that sends real-time data that connects online signals to the Ministry of Industry. In 2020, 2021, and 2022, the quality of the water is randomly checked. The quality values are as follows:
| Standard (1) | |
|---|---|
| pH | 5.5 – 9.0 |
| BOD | < 20 |
| COO | < 120 |
| Suspended Solids | < 50 |
| Grease & Oil | < 5 |
| Kjeldahl Nitrogen | < 100 |
| 2020 (2) | 2021 (2) | 2022 (2) | |
|---|---|---|---|
| pH | 8.32 | 8.22 | 8.33 |
| BOD | 10.84 | 9.34 | 8.35 |
| COO | 72.23 | 64.17 | 64.25 |
| Suspended Solids | 20.31 | 16.00 | 14.50 |
| Grease & Oil | 2.00 | 2.69 | 3.00 |
| Kjeldahl Nitrogen | 4.85 | 3.22 | 3.06 |
- The reference standards announced by the Ministry of Industry
- The average value from the monthly measurements of each year
In 2020, 2021, and 2022, the Company had total water consumption in production activities of 333,578 cubic meters, 270,361 cubic meters, and 261,465 cubic meters, respectively. According to the Company’s water consumption data, it was found that in 2022, the water consumption decreased by 8,896 cubic meters.
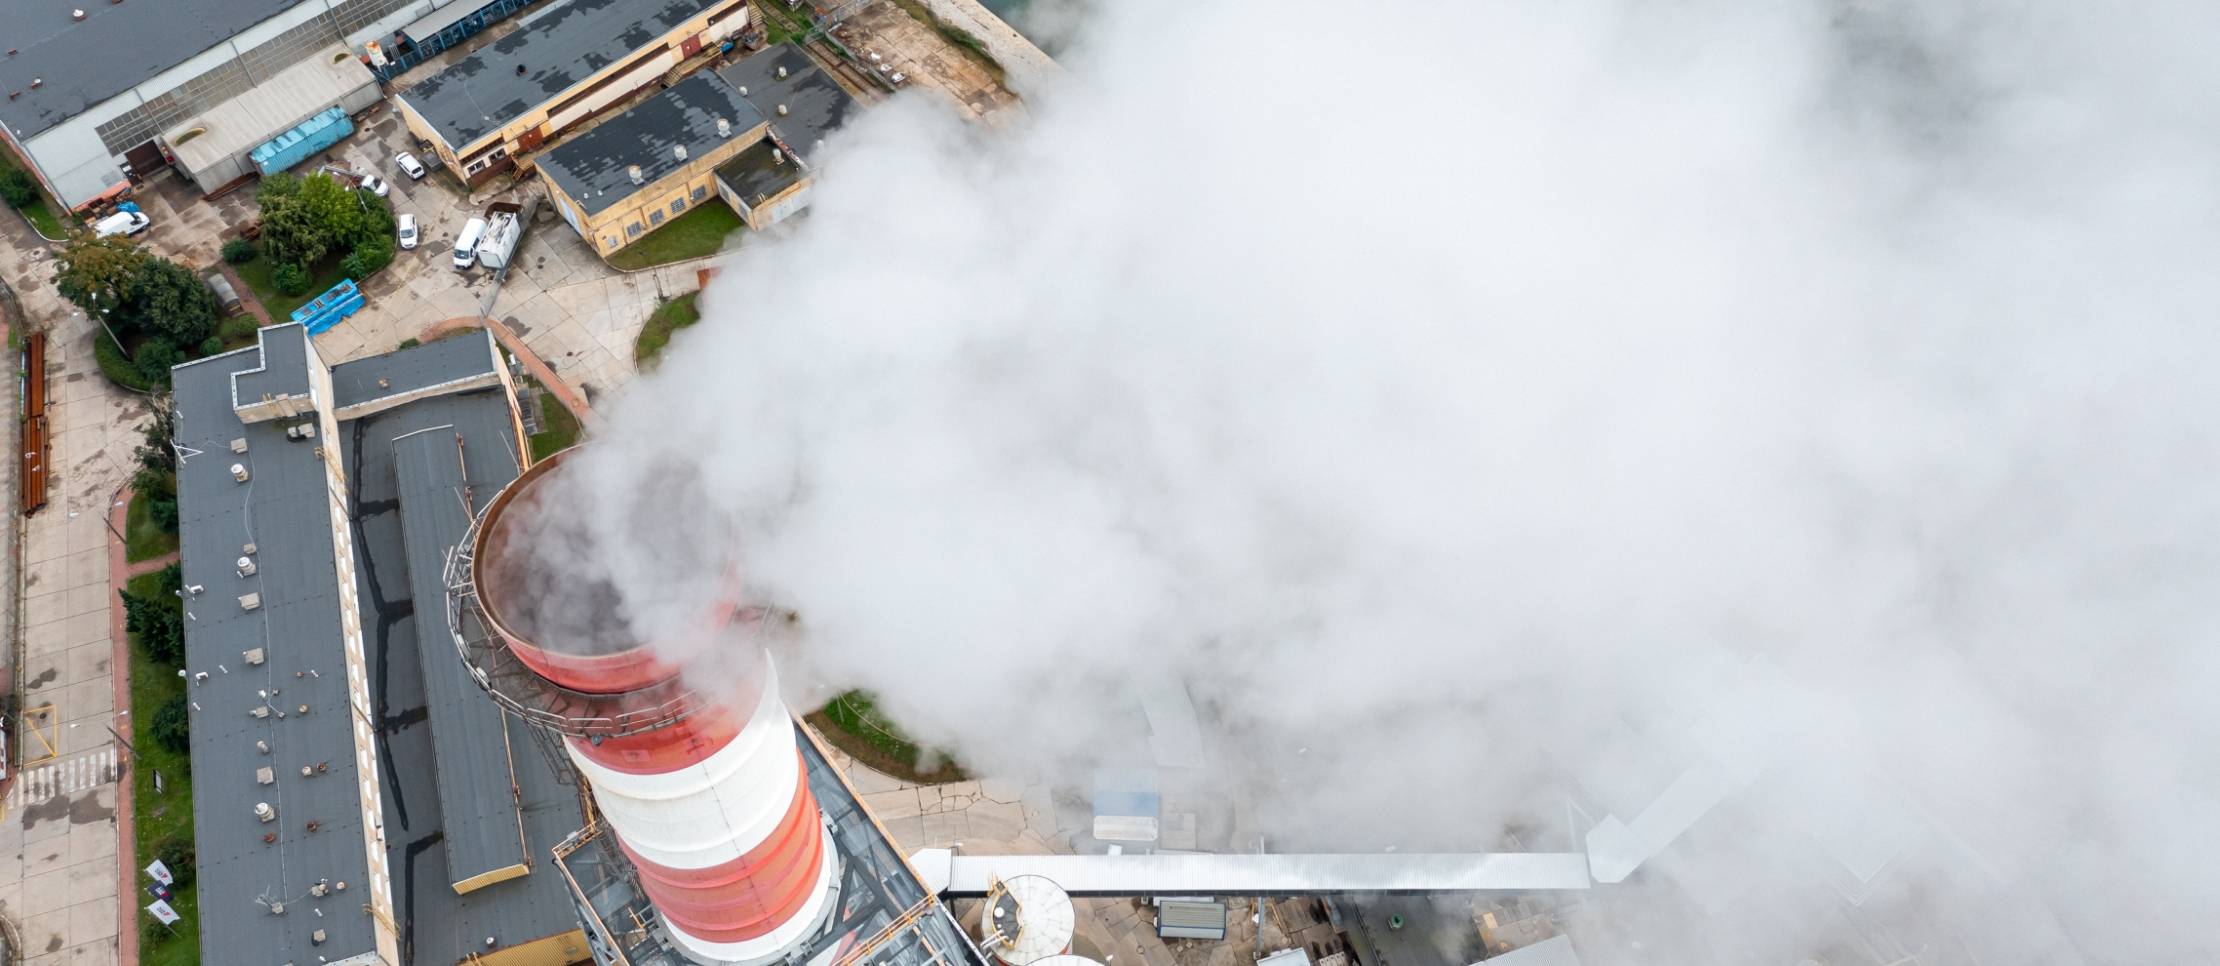
Air Management
The Company mainly uses coal-fired heat. Therefore, the Company takes the potential air pollution into account by selecting the highest quality coal emitting the least pollution and adds 2 air treatment systems to prevent dust from coal burning, namely
Multi Cyclone system
Wet Scrubber system
| Standard (1) | |
|---|---|
| Dust | < 320 |
| Sulfur Dioxide | < 700 |
| Carbon Monoxide | < 690 |
| Opacity | < 10 |
| Nitrogen Oxides | < 400 |
| 2020 (2) | 2021 (2) | 2022 (2) | |
|---|---|---|---|
| Dust | 59.50 | 64.40 | 39.00 |
| SulfurDioxide | 32.20 | 40.40 | 3.77 |
| CarbonMonoxide | 100.33 | 110.20 | 54.50 |
| Opacity | 5.00 | 5.00 | 5.00 |
| NitrogenOxides | 58.83 | 102.40 | 92.33 |
- U.S. EPA reference standards and the Ministry of Industry announcements
- The values shown in the table are the average values from the 2 times a year measurements. The values from such quality measurements represent the values at a specific point in time, not a cumulative value of ventilation each year.
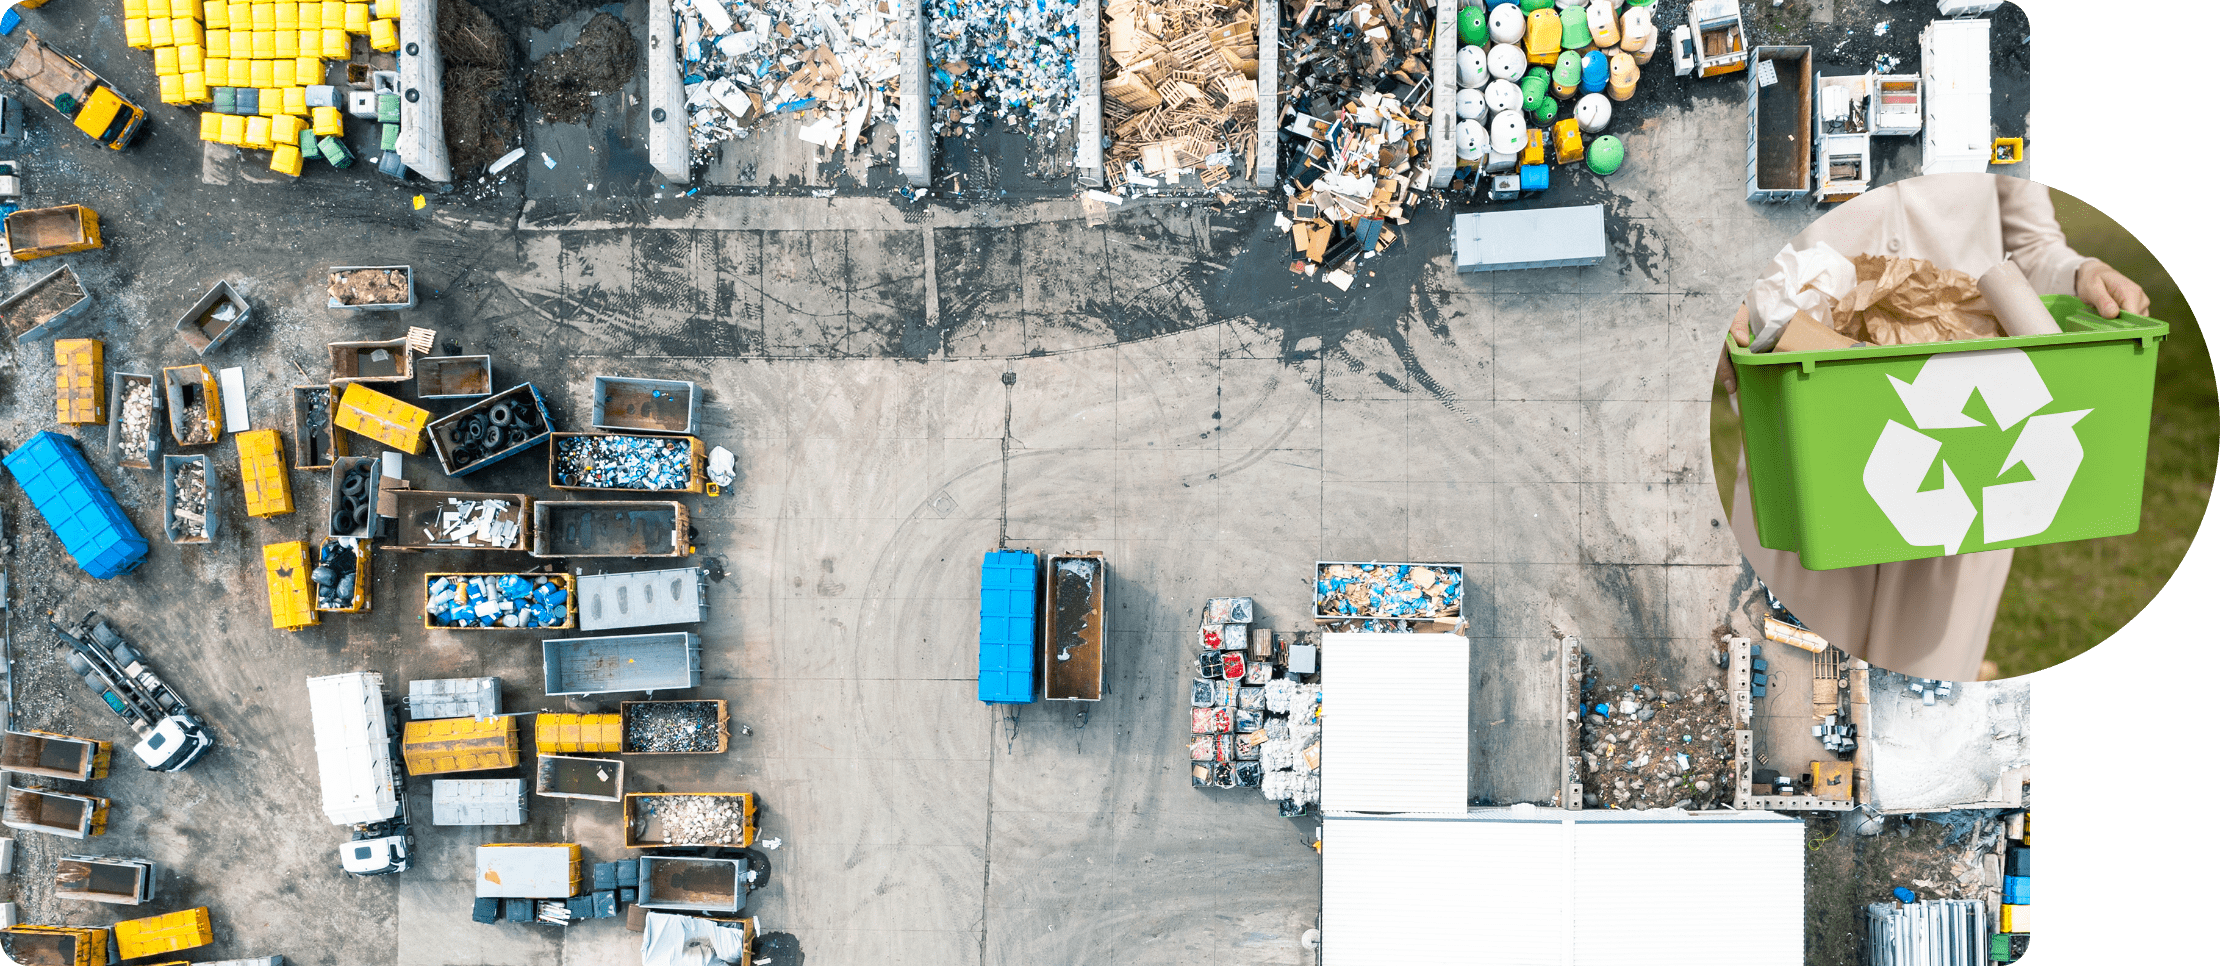
Waste and Unused Material Management
The Company employs a waste treatment and disposal person licensed by the Department of Industrial Works to be responsible for transporting waste from the factory for treatment, including unused materials arising from the production process. In 2020, 2021, and 2022, there were 1,536.31 tons of waste, 1,243.92 tons of waste, and 2,336.21 tons of waste, respectively, taken out of the factory for treatment.
In 2022, there was an increase in the amount of waste while the production decreased because of excess microbial sludge in the wastewater treatment system that was brought out for removal, which would improve the performance of the wastewater treatment system.

Greenhouse Gas Management
Currently, the Company’s greenhouse gas emissions in 2020 are at 45,551 tons of carbon dioxide, with a data collection period requesting greenhouse gas emission certification from the Thailand Greenhouse Gas Management Organization (TGO) from 01 January 2020 - 31 December 2020. The certification number received is valid from July 26, 2022 to July 25, 2023.